Part 2: Making A Map
Adding geojson data:
Now that we have a working webpage and a map object we will add vector data to our map. First a layer with points and then one with polygons.
I will use the data that we created in the first tutorial, but you can use any of the data we have used in other tutorials thus far this semester.
The data must be in geojson format and use the WGS84 geographic coordinate system.
Create a data folder within the directory you are using to create your web map (in our case within the webmap_1 folder).
Adding a geojson dataset of points to your map
First we will add a polygon layer.
Prepare the polygon dataset you wish to use, use QGIS to export your chosen data in a geojson format that uses the WGS84 geographic coordinate system if it does not already exist in this form.
Save the geojson file of polygons that you plan to use in the data folder you have just created.
The instructions below use the processed NYC census blocks dataset that you used in tutorial 1 as an example. It is available in the class data folder.
To add your chosen polygon dataset to your map you will need to do three things:
- load the dataset into your map object
- create a new layer containing your geojson data and style it as you would like
- create a function that tells our map object to execute the two actions above when the webpage loads
First in your map.js file create a variable to hold the url where the dataset you are using is stored. Add this below were you defined your map variable.
var blocks_url = "./data/blocks_joined_trees_um.geojson"
Next we will use an "object method" that modifies our map object in order to add our dataset onto the map when our webpage loads. Add the following code snippet below the variable you just created with the dataset you are using.
map.on('load',function(){
  // define a 'source' for your polygons dataset
  map.addSource('blocks_data',{
    'type':'geojson',
    'data': blocks_url,
  });
  // add a new layer with your polygons
  map.addLayer({
    'id':'blocks',
    'type':'fill',
    'source':'blocks_data',
    'paint':{
      'fill-color':'#ffffff',
      'fill-outline-color':'#000000',
      'fill-opacity': 0.5
    }
  })
});
A few things to note here:
map.on()is a method which listens for a specific type of event, in this case when the page loads (defined because we specified'load'). This method waits for whatever we have defined to happen and then executes the'function'we define. Here the function adds our datasource, and creates a new layer that shows our data.- with
map.addSourcewe have defined a new data source and have given it the name'blocks_data' - the
'data'resides at the location we just defined with our variable'blocks_url' - with
map.addLayerwe are defining a new layer that will get added to our map. We have defined the'id'to be'blocks'. The'type'of the layer is'fill'. The'source'is the'blocks_data'source we defined withadd.Sourceabove. And finally'paint'lets us define how our polygons are drawn.
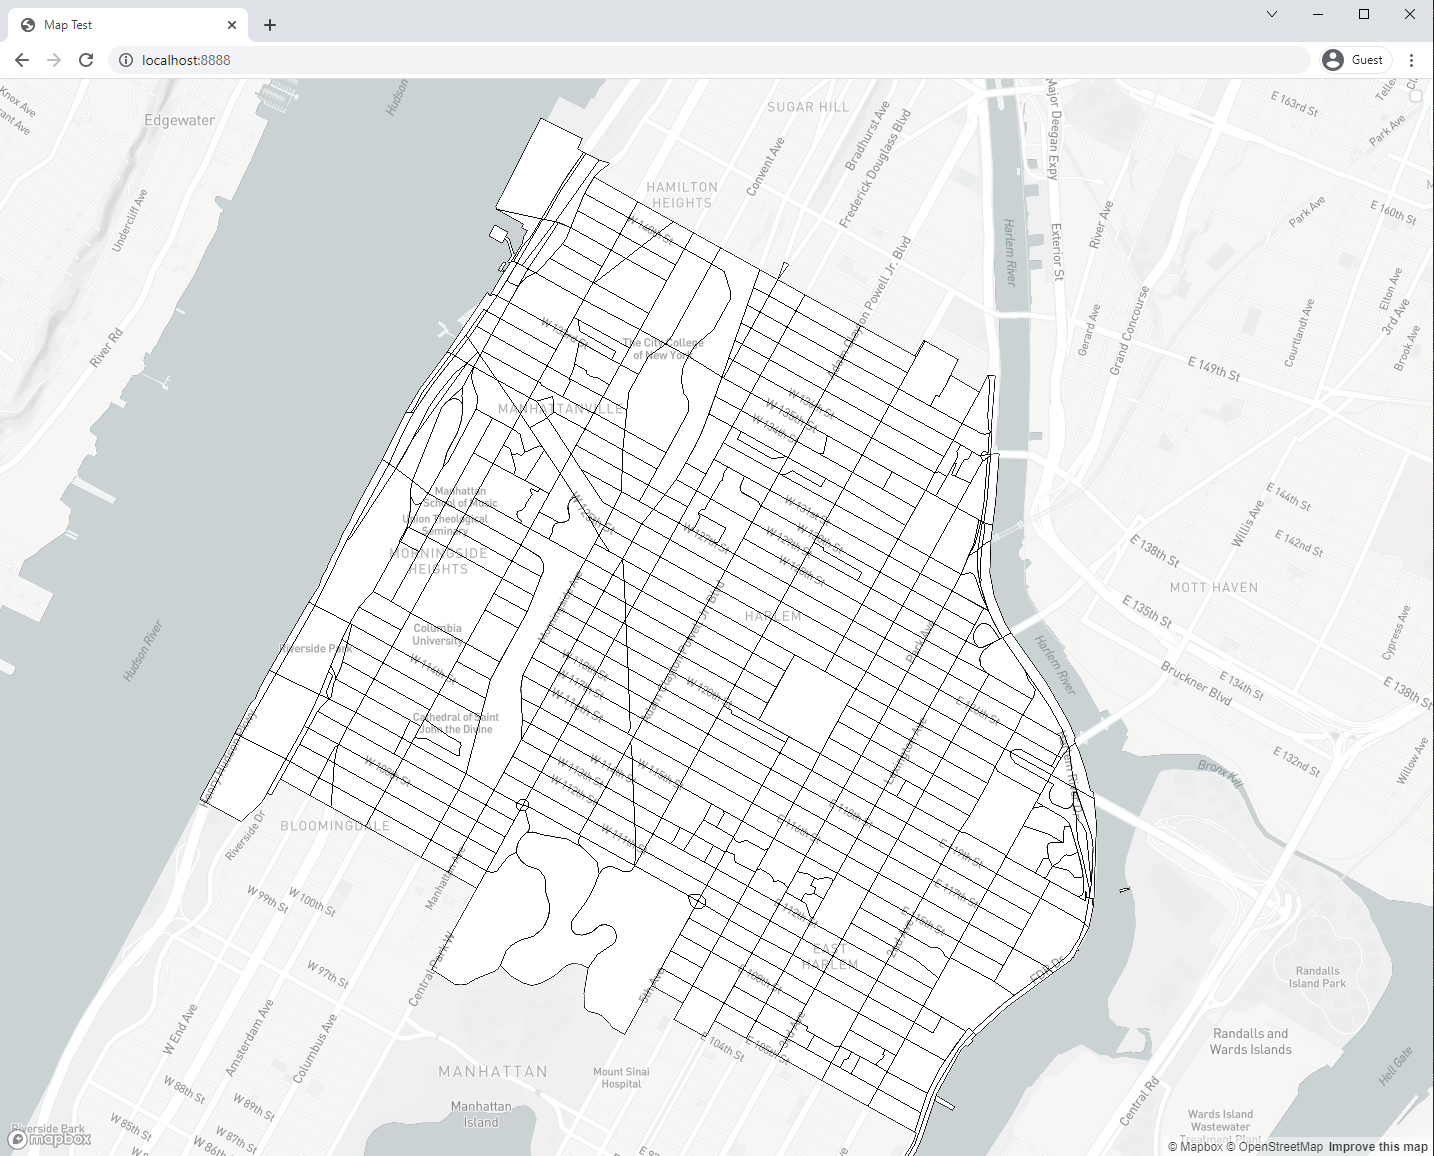
Save your map.js file and reload your browser. You should see the blocks!

Adding a geojson dataset of points to your map
Next we will add a point layer.
Save the geojson file of points that you plan to use in the data folder you have just created.
The instructions below use the NYC street trees dataset that you used in tutorial 1 as an example. If you don't have it ready, it is available here.
We will repeat the steps above that we used for the polygons:
- load the dataset into your map object
- create a new layer containing your geojson data and style it as you would like.
First in your map.js file create a new variable containing the url of your point dataset). Place this just below the variable you created for your points dataset.
var trees_url = "./data/2015_Street_Tree_Census_subset_um.geojson"
Next we will use the .addSource and .addLayer methods to add these points to our map.
Inside the map.on('load') function that you defined above include the code snippet below. (Pay careful attention to making sure that you maintain the pairs of brackets and parentheses around each method when you do this).
  // define a 'source' for your point dataset
    map.addSource('trees_data',{
      'type':'geojson',
      'data': trees_url
    });
    // add a new layer with your points
    map.addLayer({
      'id':'trees',
      'type':'circle',
      'source':'trees_data',
      'paint':{
        'circle-color': '#349f27',
        'circle-opacity':0.7,
        'circle-radius':4
      },
    })
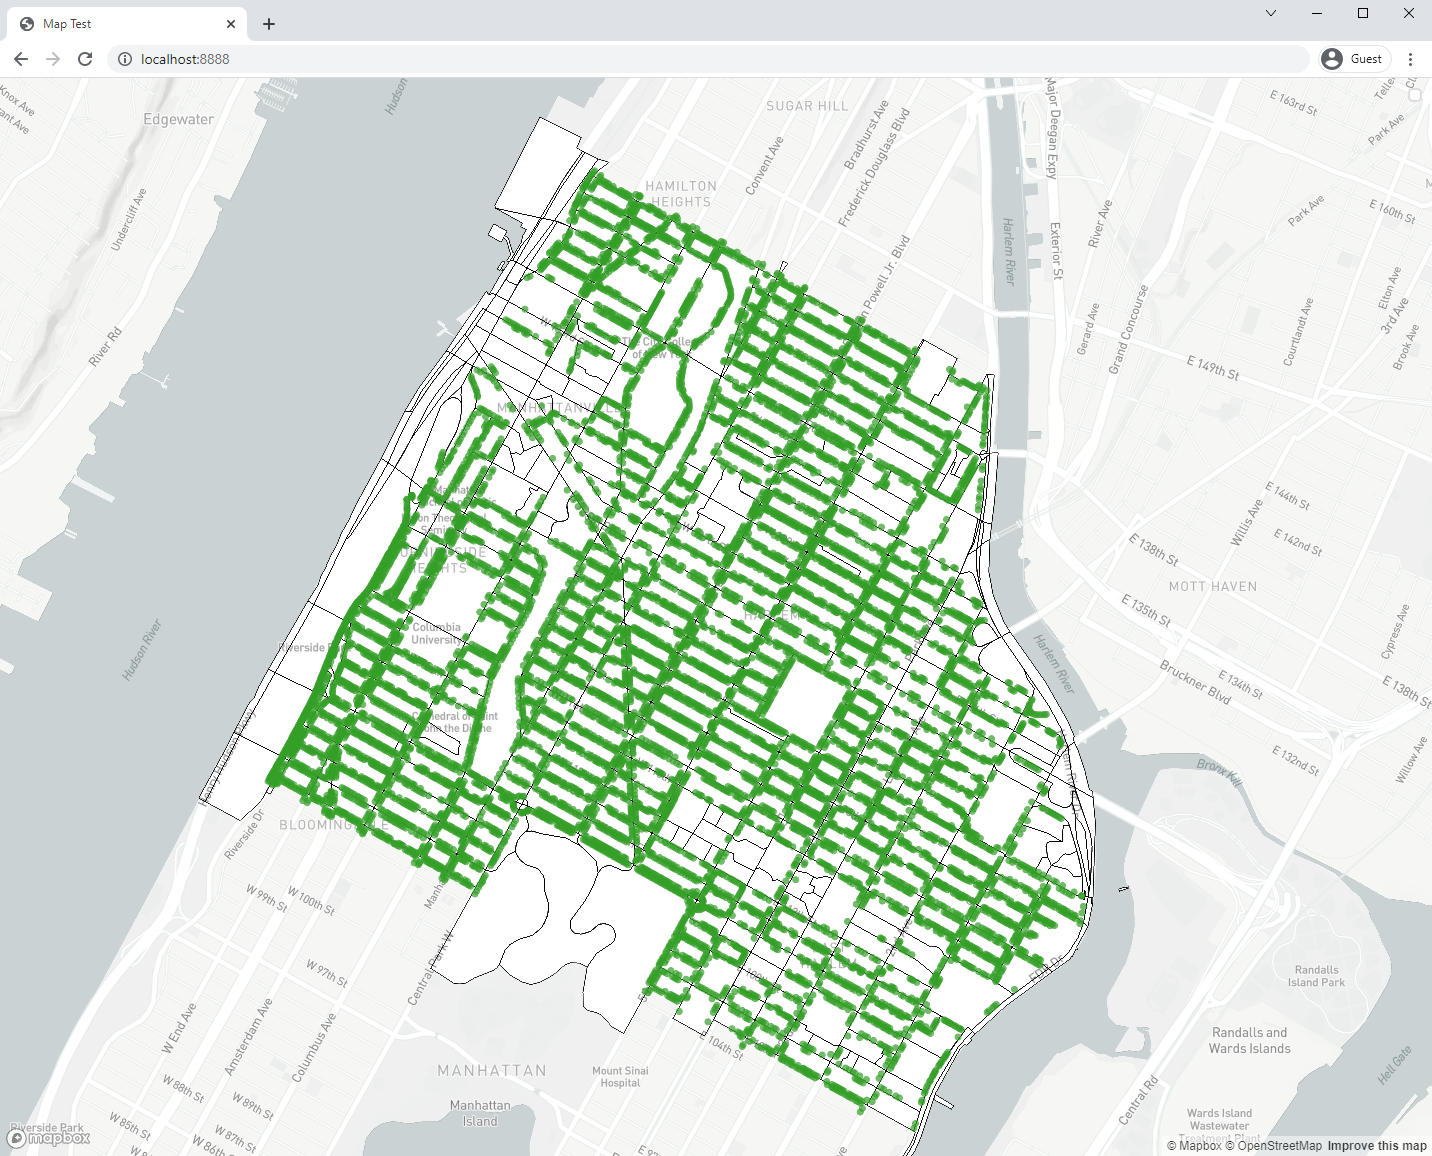
Save your map.js file and reload your browser window. You should see the tree dataset you just added to your map!

Data - Driven Styling
Now that we have our data on the map, we will want to style it using the data itself, similarly to how we did in QGIS.
To do this, it may be useful to pull up the QGIS project from the first tutorial so we can reference the variables we styled from, and what the buckets were in each.
Styling the block layers
In the original tutorial, we joined the street trees dataset to the block groups, and then styled the fill of the blockgroups by the average diameter of tree on that block.
To do this in Mapbox GL JS, we fill just edit the fill-color property to have multiple steps, with colors associated for each. Copy and paste this over your entire block_data source + layer:
 // add a new layer with your polygons
  map.addLayer({
    'id':'blocks',
    'type':'fill',
    'source':'blocks_data',
    'paint':{
        'fill-color':
          ['case',
          ['==', ['get', 'avg_diamet'], null],
          'white',
          ['step', ['get', 'avg_diamet'],
            '#ffffff',
            2.615, '#edf8e9',
            6.444, '#bae4b3',
            9.379, '#74c476',
            15.036, '#31a354',
            26.000, '#006d2c'
          ]],
      'fill-outline-color':'#000000',
      'fill-opacity': 0.5
    }
  })
There are a couple of things going on here:
- Instead of giving a single value for
fill-color, we are styling across a property, which in this case is 'avg_diamet'. If nothing is showing for you, first check that your variable is named the same thing. - We
getthat variable with['step', ['get', 'avg_diamet'], followed by our values. The first value,#ffffffis a fallback for 0, and the rest are theavg_diametvalues I copied over from QGIS, followed by their respective color. - While I could have copied over colors from QGIS, I used ColorBrewer2 for map styles.
- The three lines that start with
['caseperform the function of sorting out null values from the dataset, and making them white. Without this Mapbox would default to making them black. - Lastly, there are many ways to do this correctly, this is just one of them. Don't get caught up too much in the specific syntax of this example and don't worry if you find something different online, both will probably work.
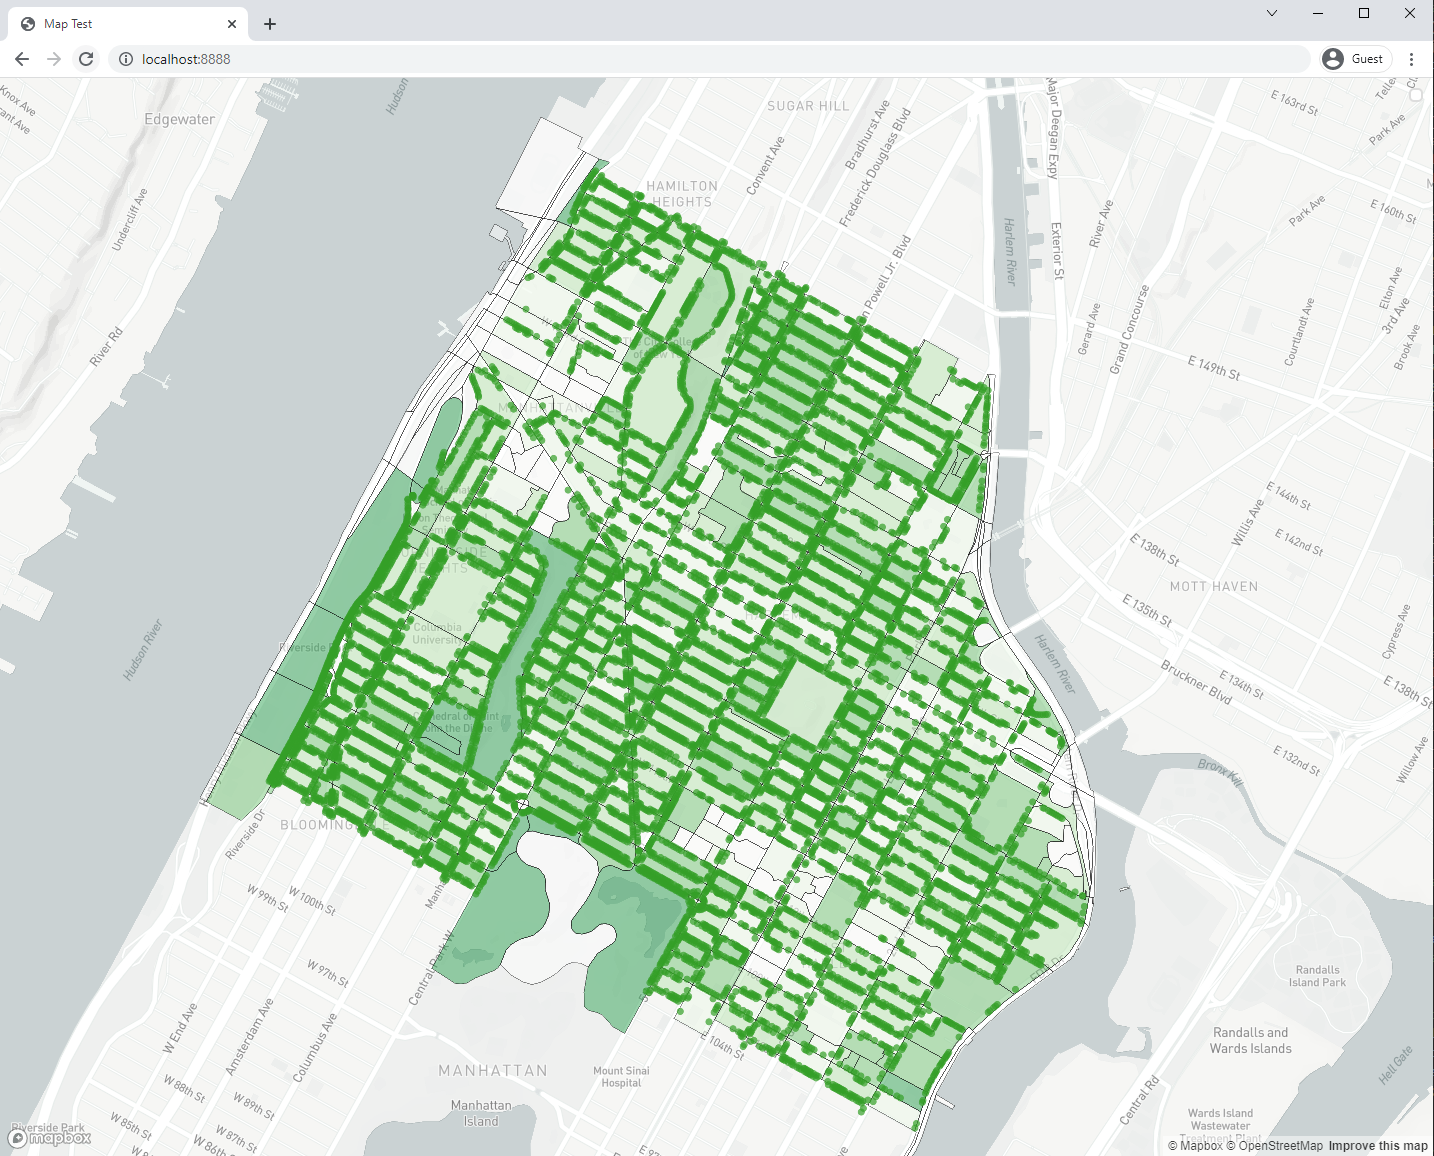
Save your map, refresh if you need to, and you should see this:

Styling the tree layers.
Next, we will style the tree layers.
This will be a bit more straight forward, because we are styling a numeric property, circle-radius', with another numeric property from our dataset tree_dbh`.
Copy and paste this over your entire trees_data source + layer:
   // define a 'source' for your point dataset
    map.addSource('trees_data',{
      'type':'geojson',
      'data': trees_url
    });
    // add a new layer with your points
    map.addLayer({
      'id':'trees',
      'type':'circle',
      'source':'trees_data',
      'paint':{
        'circle-color': '#349f27',
        'circle-opacity':0.7,
        'circle-radius': ['/', ['get', 'tree_dbh'], 5],
      },
    })
Here, all of the styling takes place in 'circle-radius': ['/', ['get', 'tree_dbh'], 5],. Originally I had 'circle-radius': ['get', 'tree_dbh'], which made the mapbox radius unit exactly the tree diameter in feet contained in the tree_dbh variable. This was comically large, so I the code around it divided that value by 5.
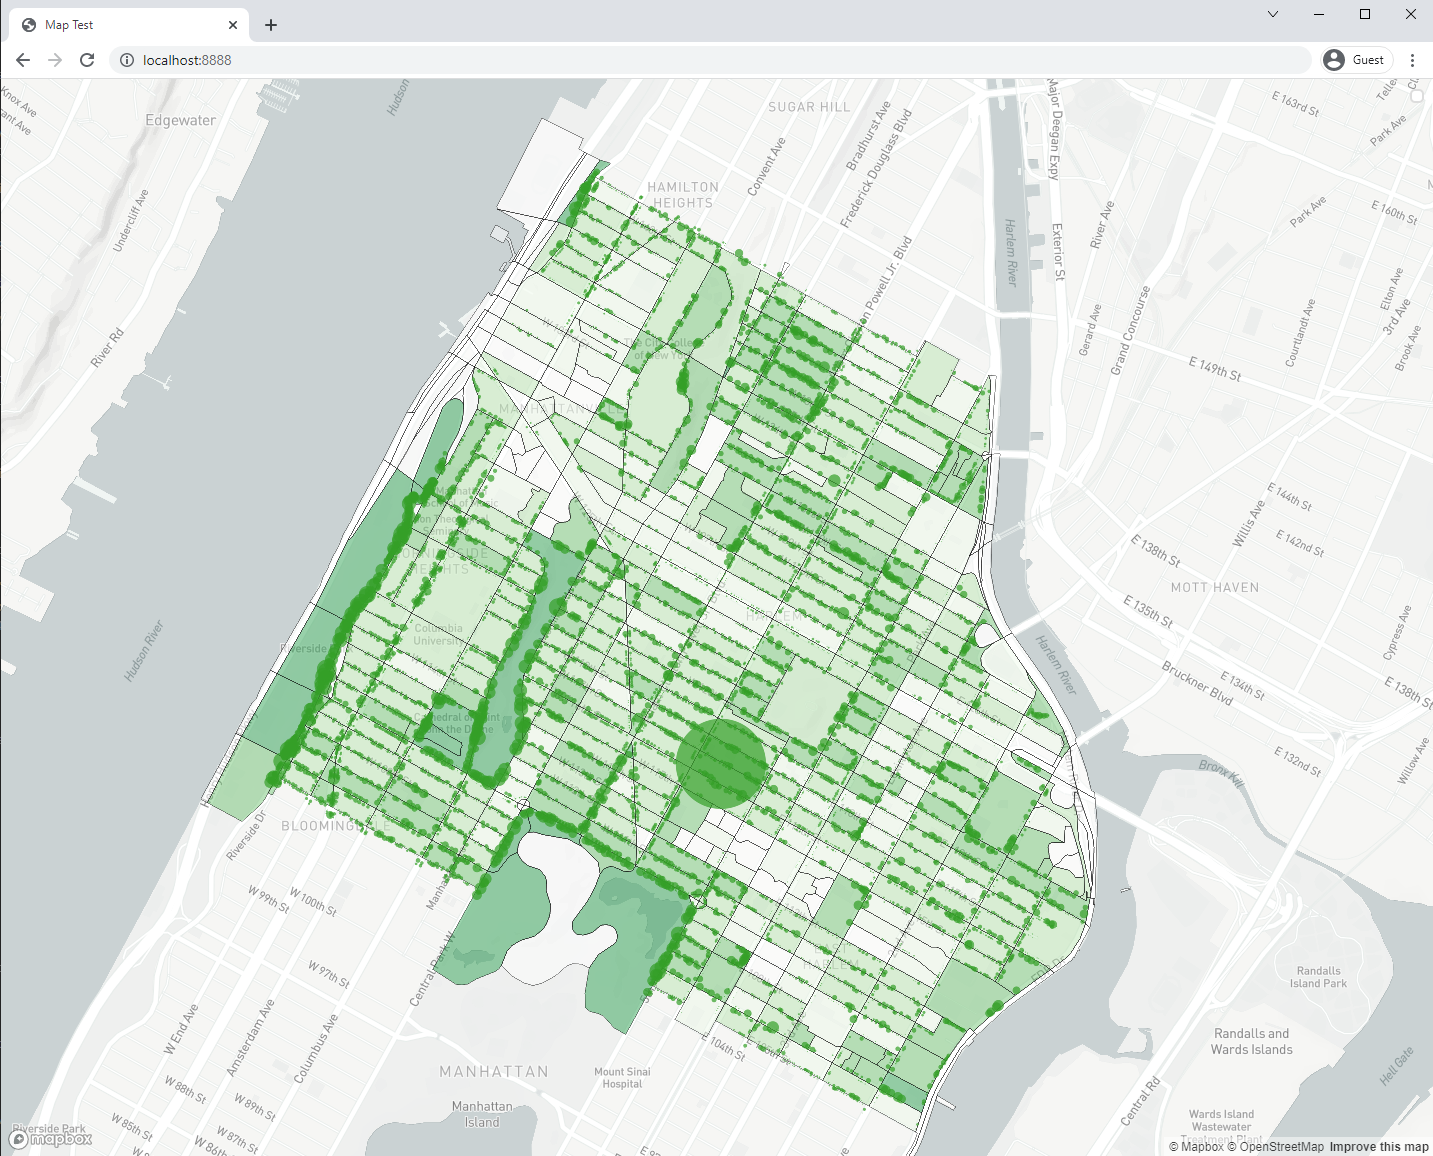
After you'ved added that, your map should look like this.

Looks like I have a giant tree on 117th street, this could be the result of either an error in the original datset, an error in how we processed it, or a giant tree on 117th street that I haven't noticed before. You could fix this by either editing it in the dataset itself, or if it was important for you to maintain a direct proportion to the actual tree diameter, you could change the styling of circle-radius to buckets instead of a linear scale (like we did in QGIS.)
Styling alternatives
If you find all of that styling tedious, you're not alone! Luckily Mapbox also has a GUI that allows you to style a map called Mapbox Studio. There, you can style a layer, and then add it to your map.js using it's tilesetID.
This is sometimes quicker for simple maps with precise styling, but you lose some potential for interactiviy in the procress. Here is the Mapbox Documentation for that workflow.
Pushing to Github
Once you have created an map that you like lets publish it online by pushing our changes to GitHub. Open your terminal or command prompt. Make sure you are within the folder where you created your web map (in our case webmap_1).
- Type
git add -Ato 'track' all of the changes you made. - To commit your changes type
git commit -m "some note about the changes you made"and replace the information within the quotes with some note to yourself about the changes you made. - Then push your changes to the server by typing
git push.
Visit your repository website at yourgithubusername.github.io/webmap_1 to check that all changes were pushed correctly.
Adding Interactivity
After completing the above portions of this tutorial you now should have a functioning web map. Congrats! With the help of some Javascript, we managed to get something similar to our QGIS static map onto the web by defining its content (raster and vector data) and style (symbology). Here we'll start to look at where Javascript really shines: defining behavior, interactivity and change over time in your web map.
About Events
One of the simplest forms of interactivity is to have something happen when you click an element on the page, or in this case, our map. Javascript uses the concept of events to define this kind of behavior. This is a two-part approach: you first need to designate an element on your page as an event listener, then provide instructions in the form of an event handler that say what to do when the event takes place. A basic example would look something like this:
// listen for 'onclick' events from 'handler-element'
document.getElementById('handler-element').onclick = handleEvent;

// say how to handle the events that are fired by the listener
function handleEvent(e) {
  console.log("an event happened")
}
Once the browser loads this bit of code, every time the user clicks a page element with the given ID an event will be fired and the code inside the event handler will be executed. We're not using it here but notice that the event handler is being passed an object e that we can use to get information about the element being clicked, where the cursor was on the screen at the time, and other useful things.
This is a good start but it's not going to get us very far when we're dealing with even a modestly-sized collection of map data. Consider the street trees we added to our web map in the last tutorial. If we wanted to create a pop-up label with the tree species every time a different tree was clicked, how would we do it?
Doing this with the pattern described above, we'd need to first create event listeners on each individual point. Even though we'd be able to reuse the same event handler function for each one, it'd also be a lot of work to, say, create a pop-up with the species name of the tree each time it was clicked. We'd need to first unpack the e object to access the properties of the clicked element, then relate it somehow to the original dataset, traverse the list of properties and get the value of the species name - all that before even starting to think about how to create and style a new page element with the name written in it, and to give ourselves some mechanism to make it go away once we don't want it anymore.
Making Popups on Click Events with Mapbox GL
Fortunately, Mapbox GL provides us with a bunch of readymade objects and functions so we don't need to reinvent the wheel. Remember from last time that in order to create a map on our page we're making a new Map object using the library. We used on('load', ...), which is an all-in-one event listener and handler, addSource() and addLayer() functions that are part of the Map object to describe and render the map. We can use different versions of that same on() function to automatically create event patterns for every element in a map layer, and Mapbox's Popup object can help us with creating the pop-up itself. Copy and paste the following sample code into your map.js file:
// when the user does a 'click' on an element in the 'trees' layer...
map.on('click', 'trees', function(e) {
  // get the map coordinates of the feature
  var coordinates = e.features[0].geometry.coordinates.slice();
  // get its species name from the feature's attributes
  var species = e.features[0].properties.spc_common;

  // and create a popup on the map
  new mapboxgl.Popup()
  .setLngLat(coordinates)
  .setHTML(species)
  .addTo(map);
});

// make the cursor a pointer when over the tree
map.on('mouseenter', 'trees', function() {
  map.getCanvas().style.cursor = 'pointer';
});

// back to normal when it's not
map.on('mouseleave', 'trees', function() {
  map.getCanvas().style.cursor = '';
});
Now you should see a popup appear with the tree's species name whenever you click a tree on the map. Clicking another tree or clicking the 'x' on the popup should make the last popup disappear. Not bad for a couple lines of code. Notice that we can also control the appearance of the cursor to give the user a hint that some kind of interactivity is now built into the tree symbols. Thanks to the features in the library, we're able to do a surprising amount of work with just a couple of lines of code.
Other Mapbox GL Examples
Now that we've seen the basics of how to define map behavior using functions in the Mapbox GL library, you can experiment with some of the many examples they provide and try to adapt them to your map. Here are a few suggestions:
- You can adjust the opacity of a raster layer using the
valueproperty of a targeted slider to as an input to the map'ssetPaintProperty()function. Note that this example uses the plain Javascript event pattern outlined above since the behavior is for a single element outside of the map itself. - Or you can animate features on the map using two custom functions - one that defines position as a function of time and another which steps through frames of an animation, updating the position of an element with
Map.getSource(...).setData(...)each time it runs. - Or animate the 'camera' with the
flyTo()function which gradually changes thecenterandzoomproperties of theMapover time.
Using API Documentation
As you start thinking about how you might want to develop your map further, you'll want to know more about what else you can do with MapboxGL. At a certain point, working through examples and tutorials will cease to be useful and you'll want a more direct way to explore what's available. Fortunately, every legitimate Javascript library comes with a catalog in the form of its API documentation. Sometimes you'll see this referred to as "the docs" for short, and it's always going to be the most detailed, comprehensive, up-to-date, and accurate source for information on the contents of a given library and how it's meant to be used.
All of the objects, functions and properties in the library will be listed and described, often with examples, in a single online resource. So for example, if you wanted more details on how the flyTo function in the last example, you'd find it here under the instance members of the Map object. Not all API docs will do this, but Mapbox includes both links to related examples and short code snippets, which makes it even easier to learn. Feel free to explore this at your own pace and try adding some additional functionality to your map if you have the time and interest.
Full Code
Here is what your full map.js should look like in the end, and here is a live demo of it as well. Don't forget to put in your mapbox token!
'use strict'        // let the browser know we're serious

// debug statement letting us know the file is loaded
console.log('Loaded map.js')

// your mapbox token
mapboxgl.accessToken = 'YOUR TOKEN HERE'

var map = new mapboxgl.Map({
    container: 'map',
    style: 'mapbox://styles/mapbox/light-v9',
    center: [ -73.94829, 40.80781],
    zoom: 13.75
});

var blocks_url = "./data/blocks_joined_trees_um.geojson"
var trees_url = "./data/2015_Street_Tree_Census_subset_um.geojson"

map.on('load',function(){
  // define a 'source' for your polygons dataset
  map.addSource('blocks_data',{
    'type':'geojson',
    'data': blocks_url,
  });
  // add a new layer with your polygons
  map.addLayer({
    'id':'blocks',
    'type':'fill',
    'source':'blocks_data',
    'paint':{
        'fill-color':
          ['case',
          ['==', ['get', 'avg_diamet'], null],
          'white',
          ['step', ['get', 'avg_diamet'],
            '#ffffff',
            2.615, '#edf8e9',
            6.444, '#bae4b3',
            9.379, '#74c476',
            15.036, '#31a354',
            26.000, '#006d2c'
          ]],
      'fill-outline-color':'#000000',
      'fill-opacity': 0.5
    }
  })
  // define a 'source' for your point dataset
    map.addSource('trees_data',{
      'type':'geojson',
      'data': trees_url
    });
    // add a new layer with your points
    map.addLayer({
      'id':'trees',
      'type':'circle',
      'source':'trees_data',
      'paint':{
        'circle-color': '#349f27',
        'circle-opacity':0.7,
        'circle-radius': ['/', ['get', 'tree_dbh'], 5],
      },
    })

  });

  // when the user does a 'click' on an element in the 'trees' layer...
map.on('click', 'trees', function(e) {
    // get the map coordinates of the feature
    var coordinates = e.features[0].geometry.coordinates.slice();
    // get its species name from the feature's attributes
    var species = e.features[0].properties.spc_common;

    // and create a popup on the map
    new mapboxgl.Popup()
    .setLngLat(coordinates)
    .setHTML(species)
    .addTo(map);
  });

  // make the cursor a pointer when over the tree
  map.on('mouseenter', 'trees', function() {
    map.getCanvas().style.cursor = 'pointer';
  });

  // back to normal when it's not
  map.on('mouseleave', 'trees', function() {
    map.getCanvas().style.cursor = '';
  });

